Field Operations · Case Study

One platform replacing six.
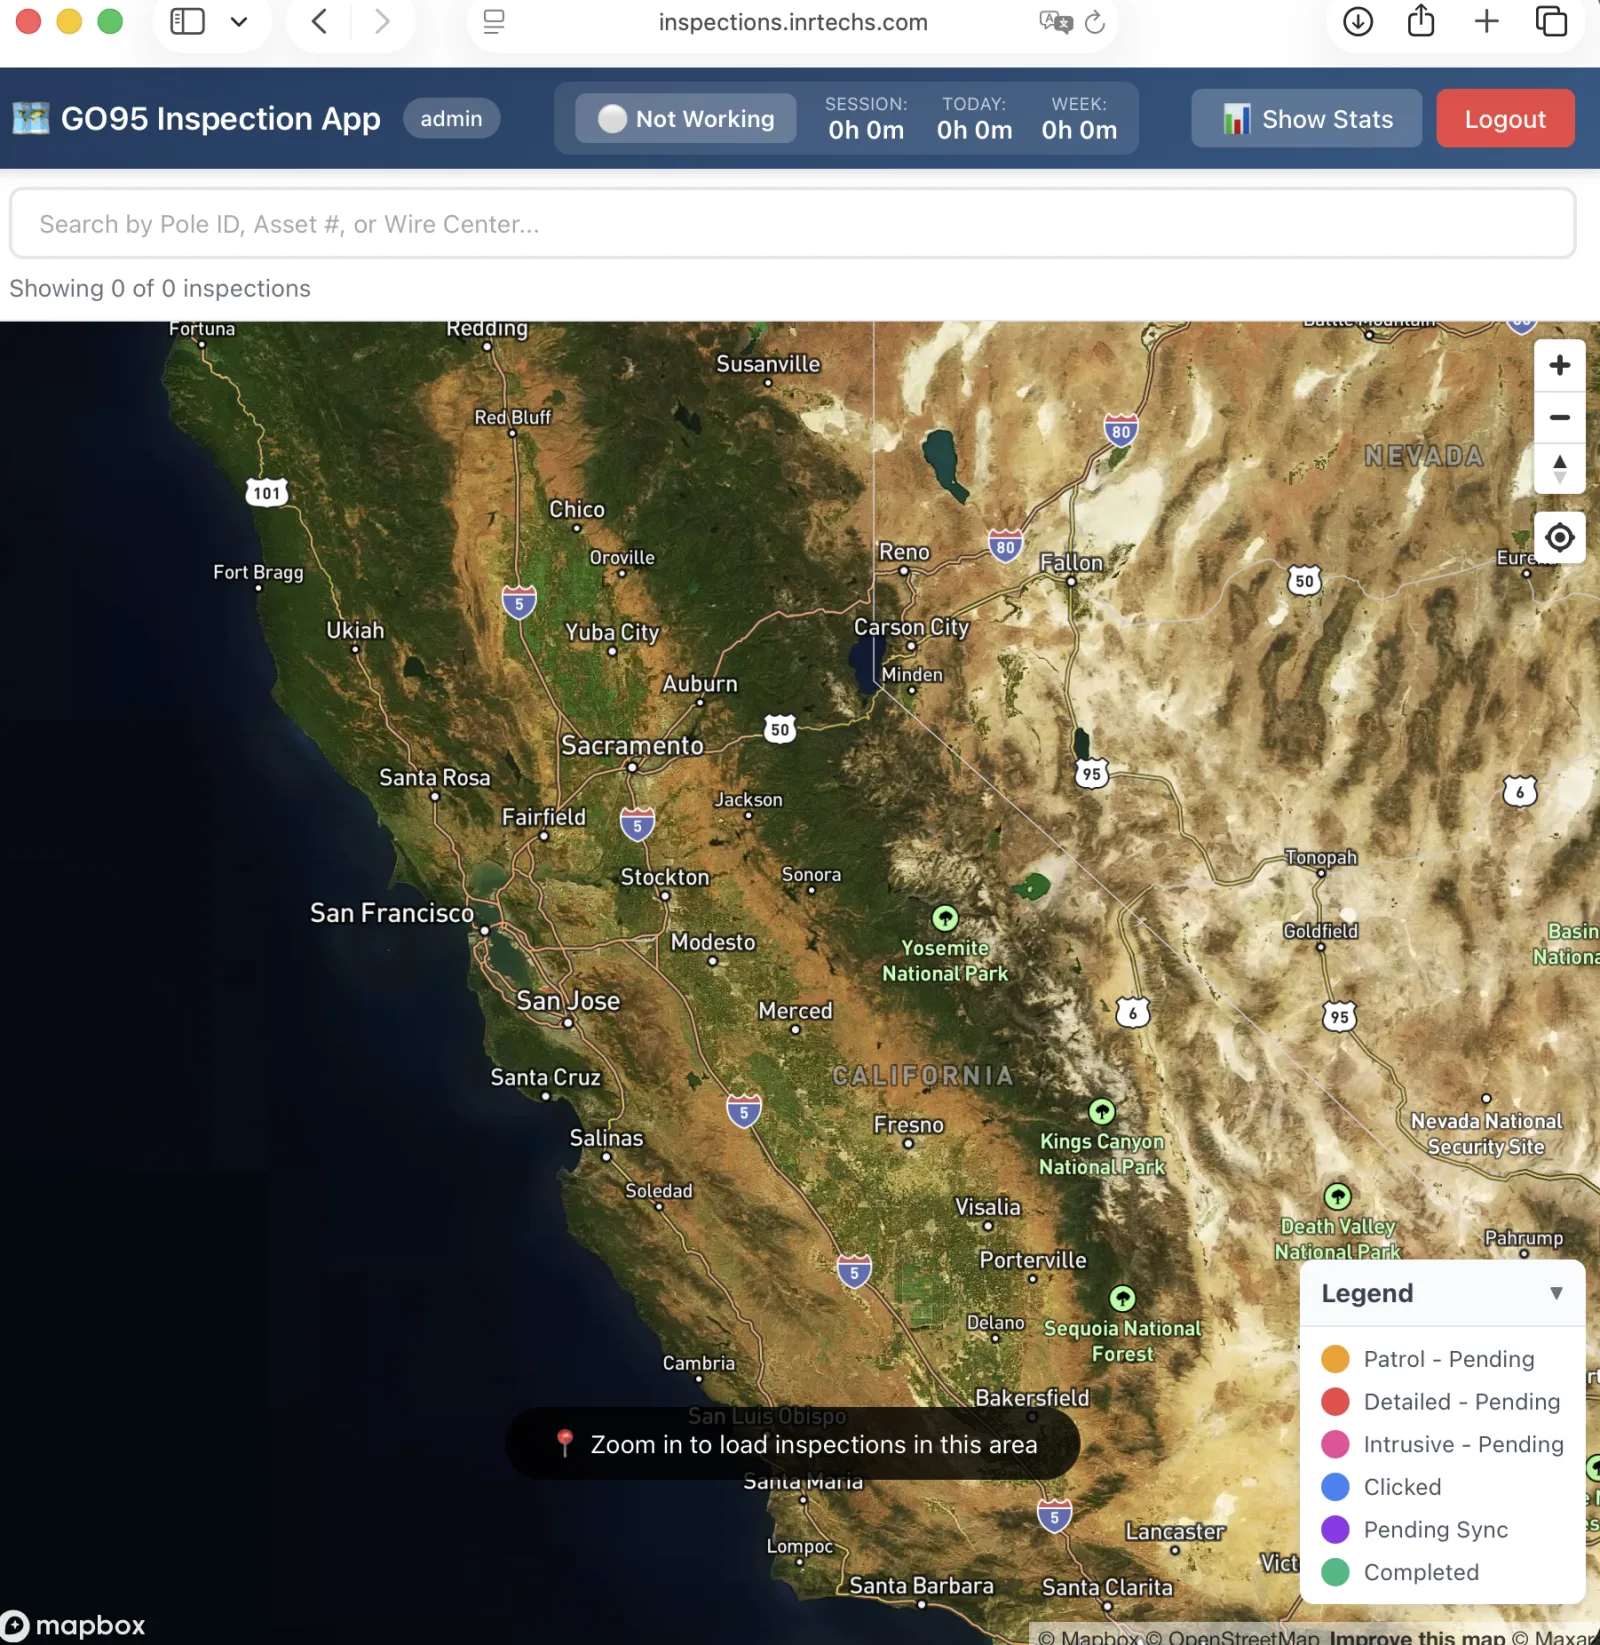
Built for utility field inspection at scale.

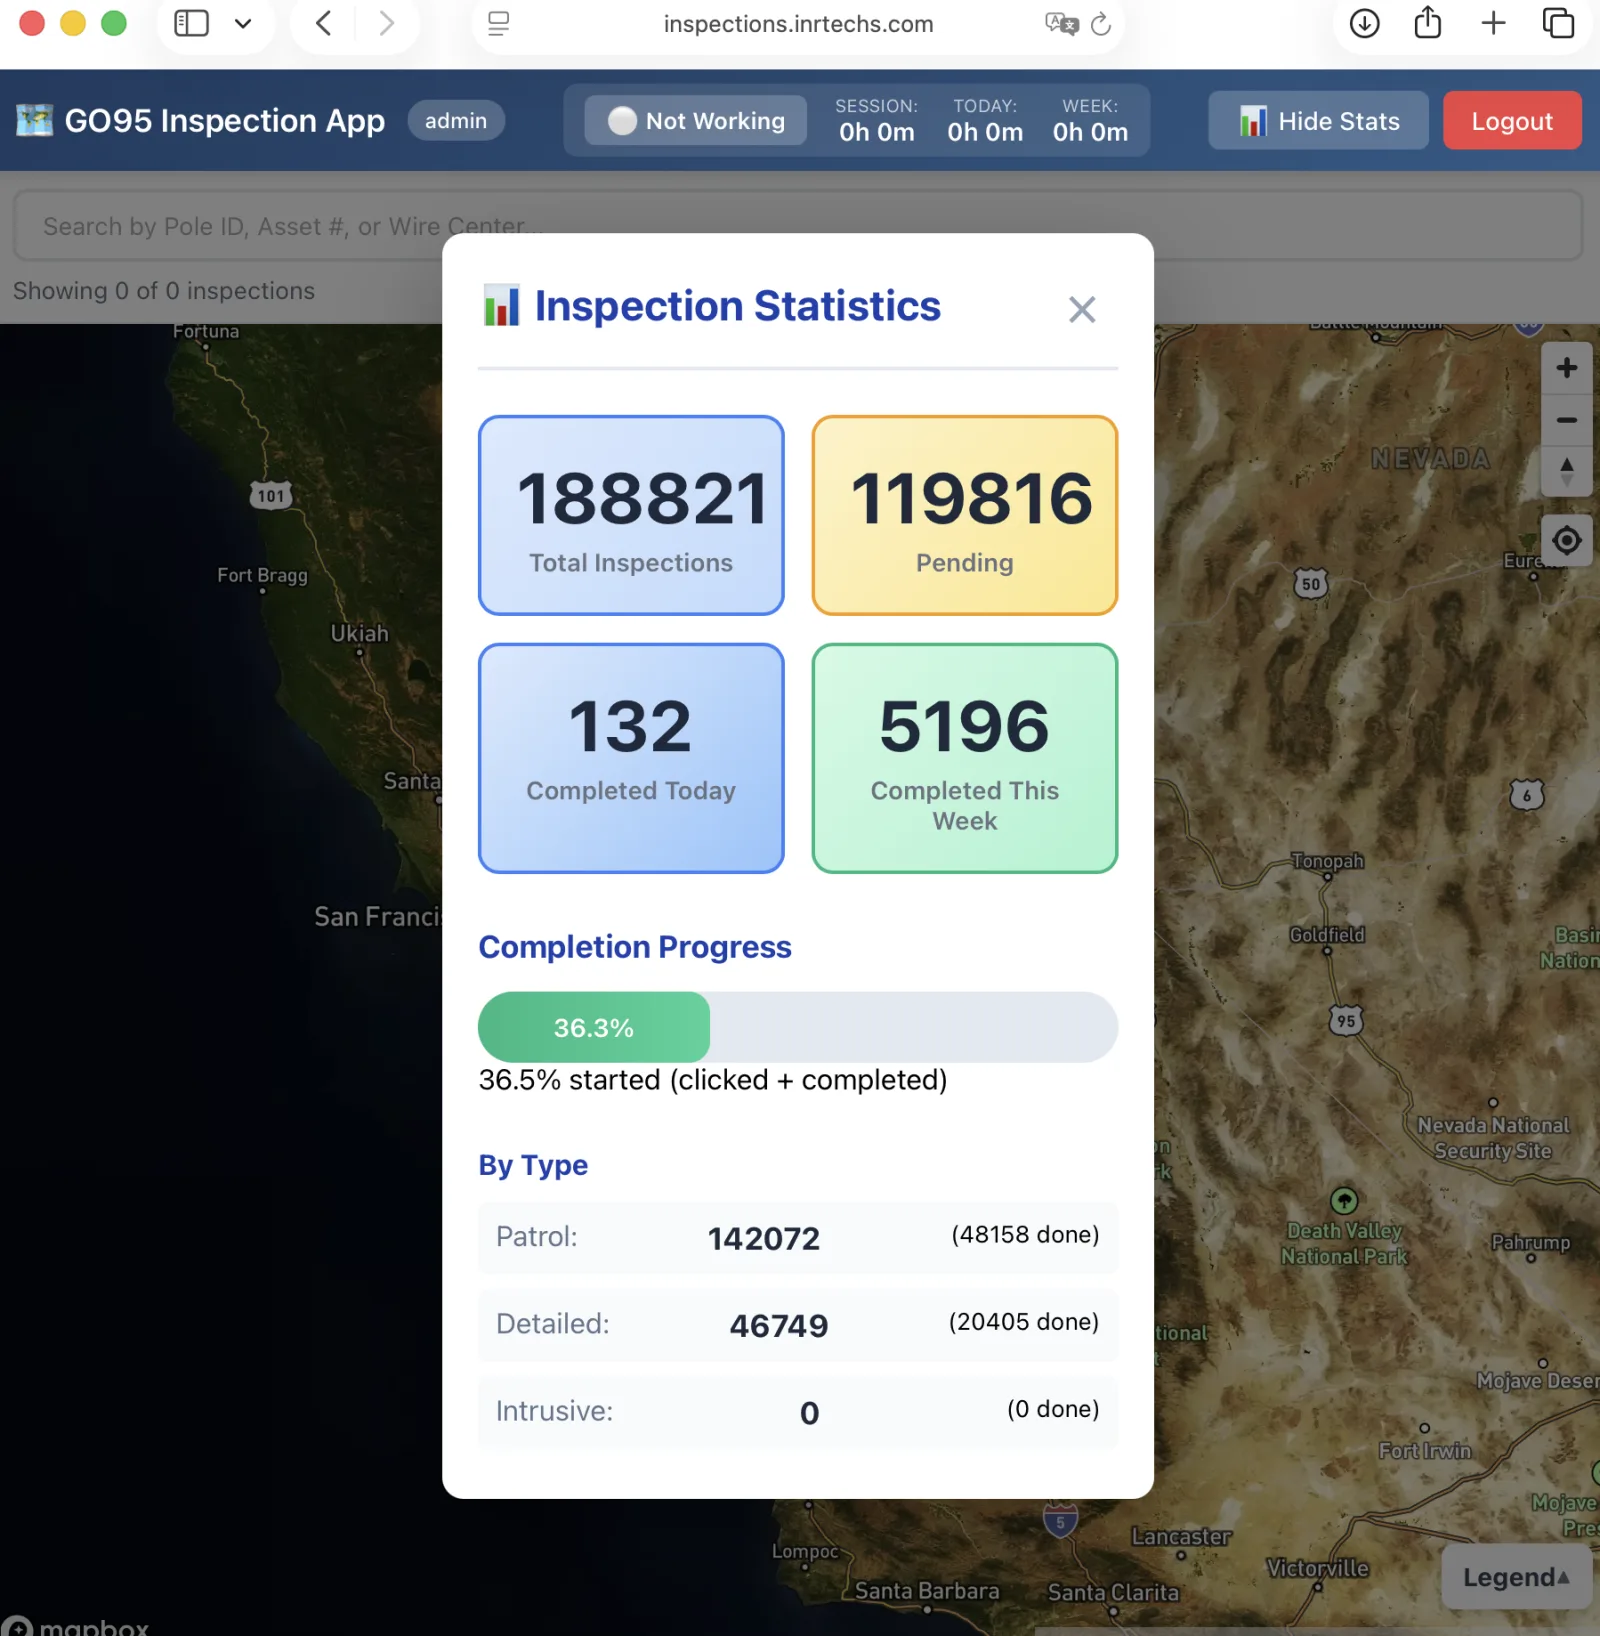
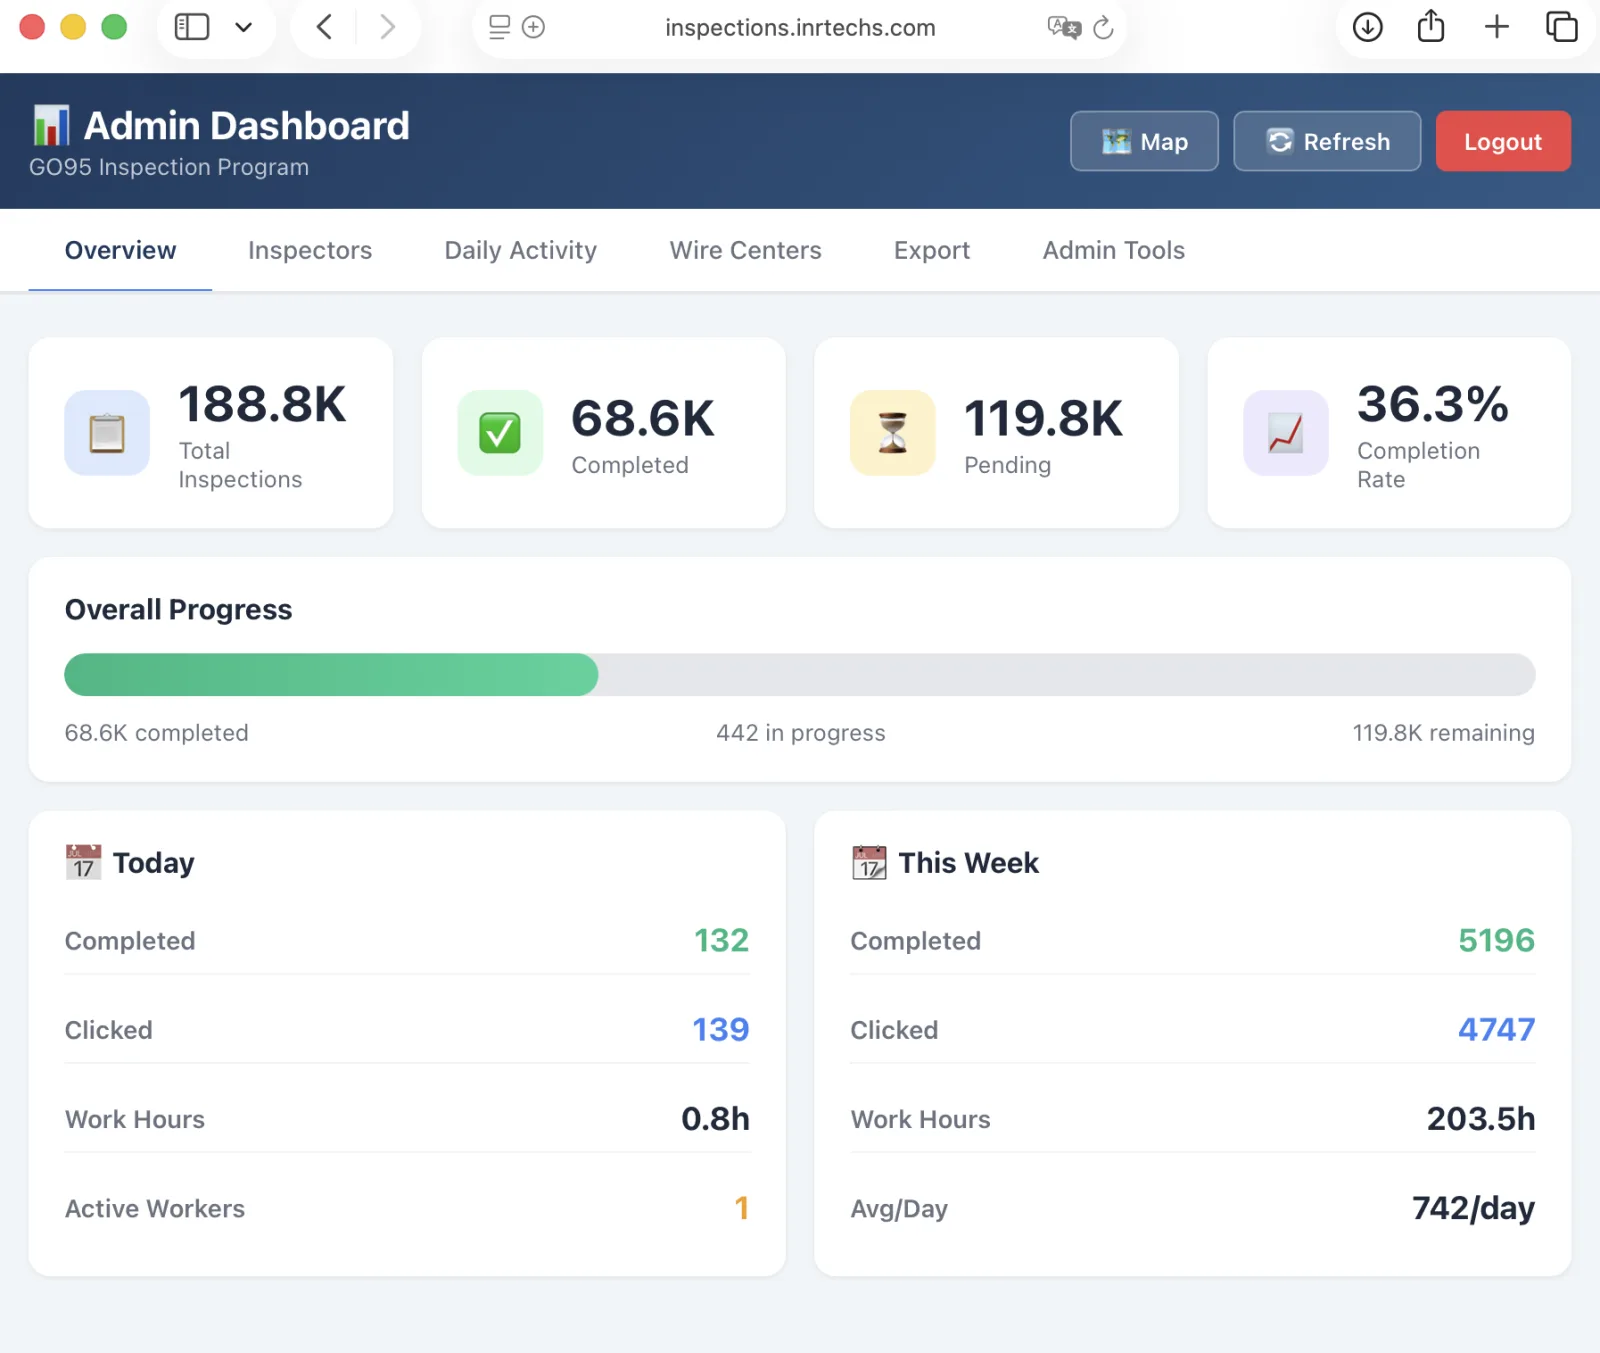
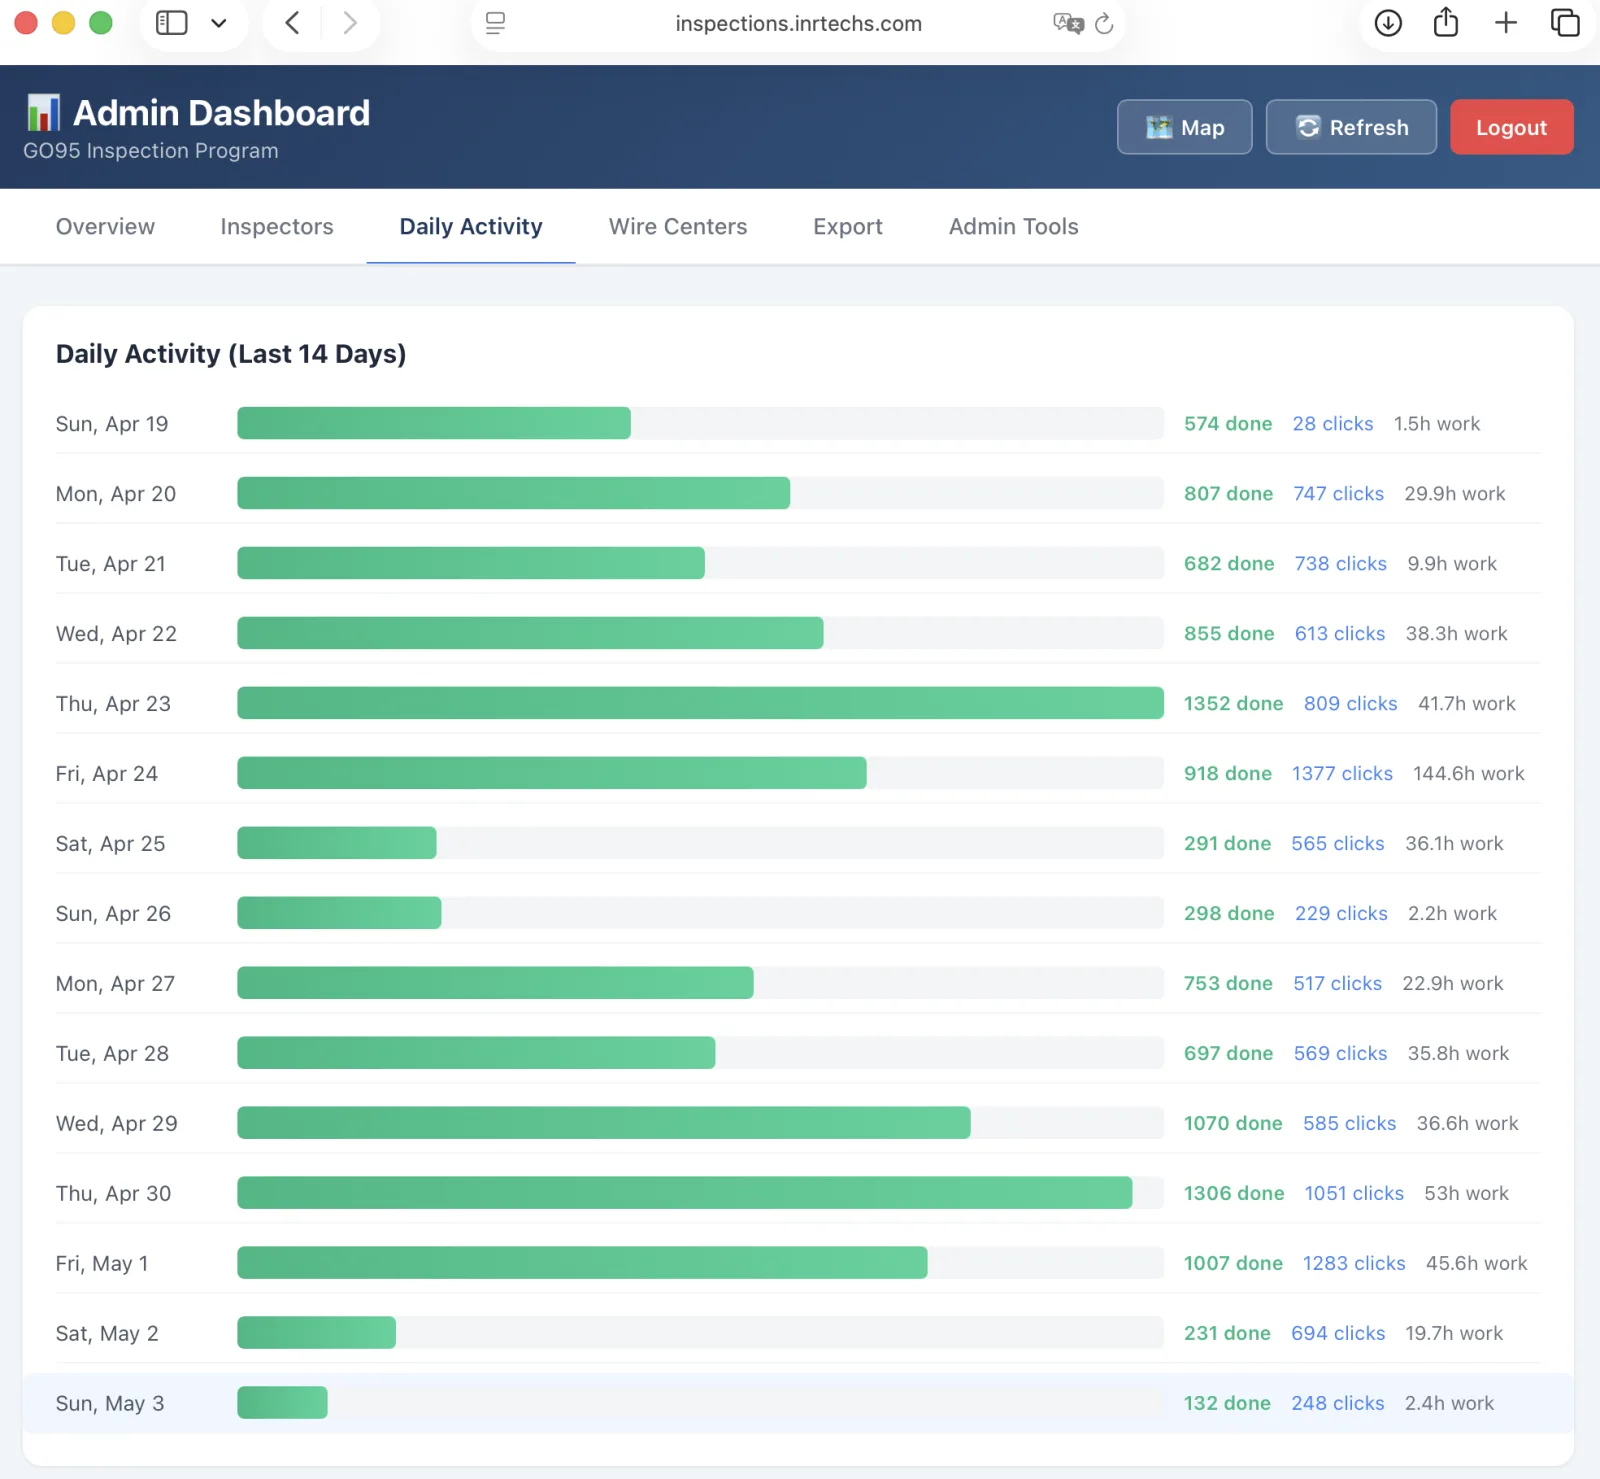
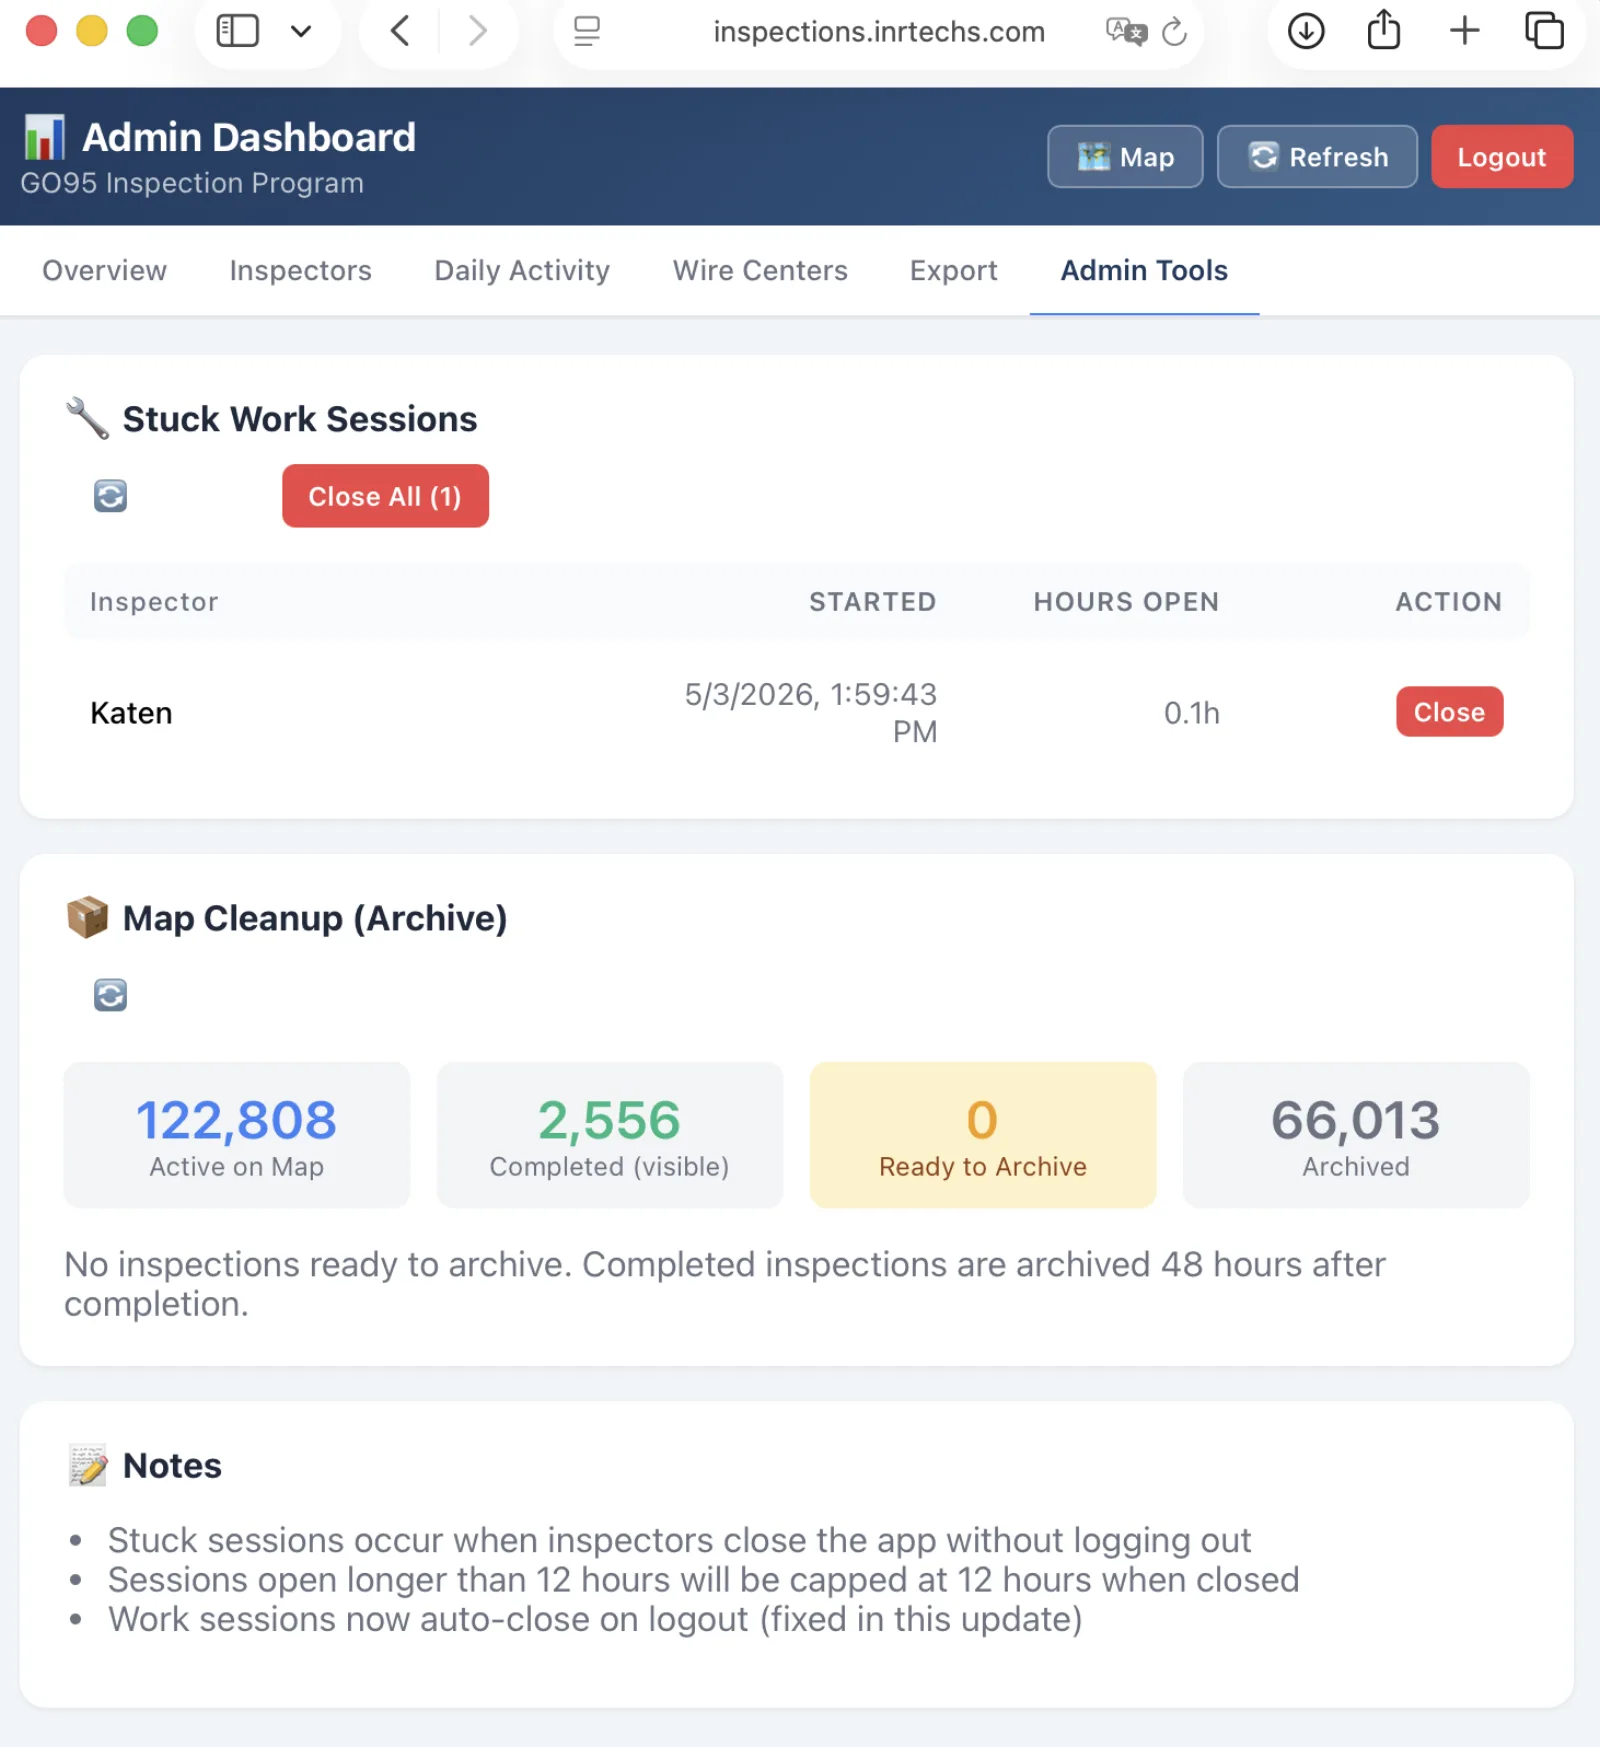
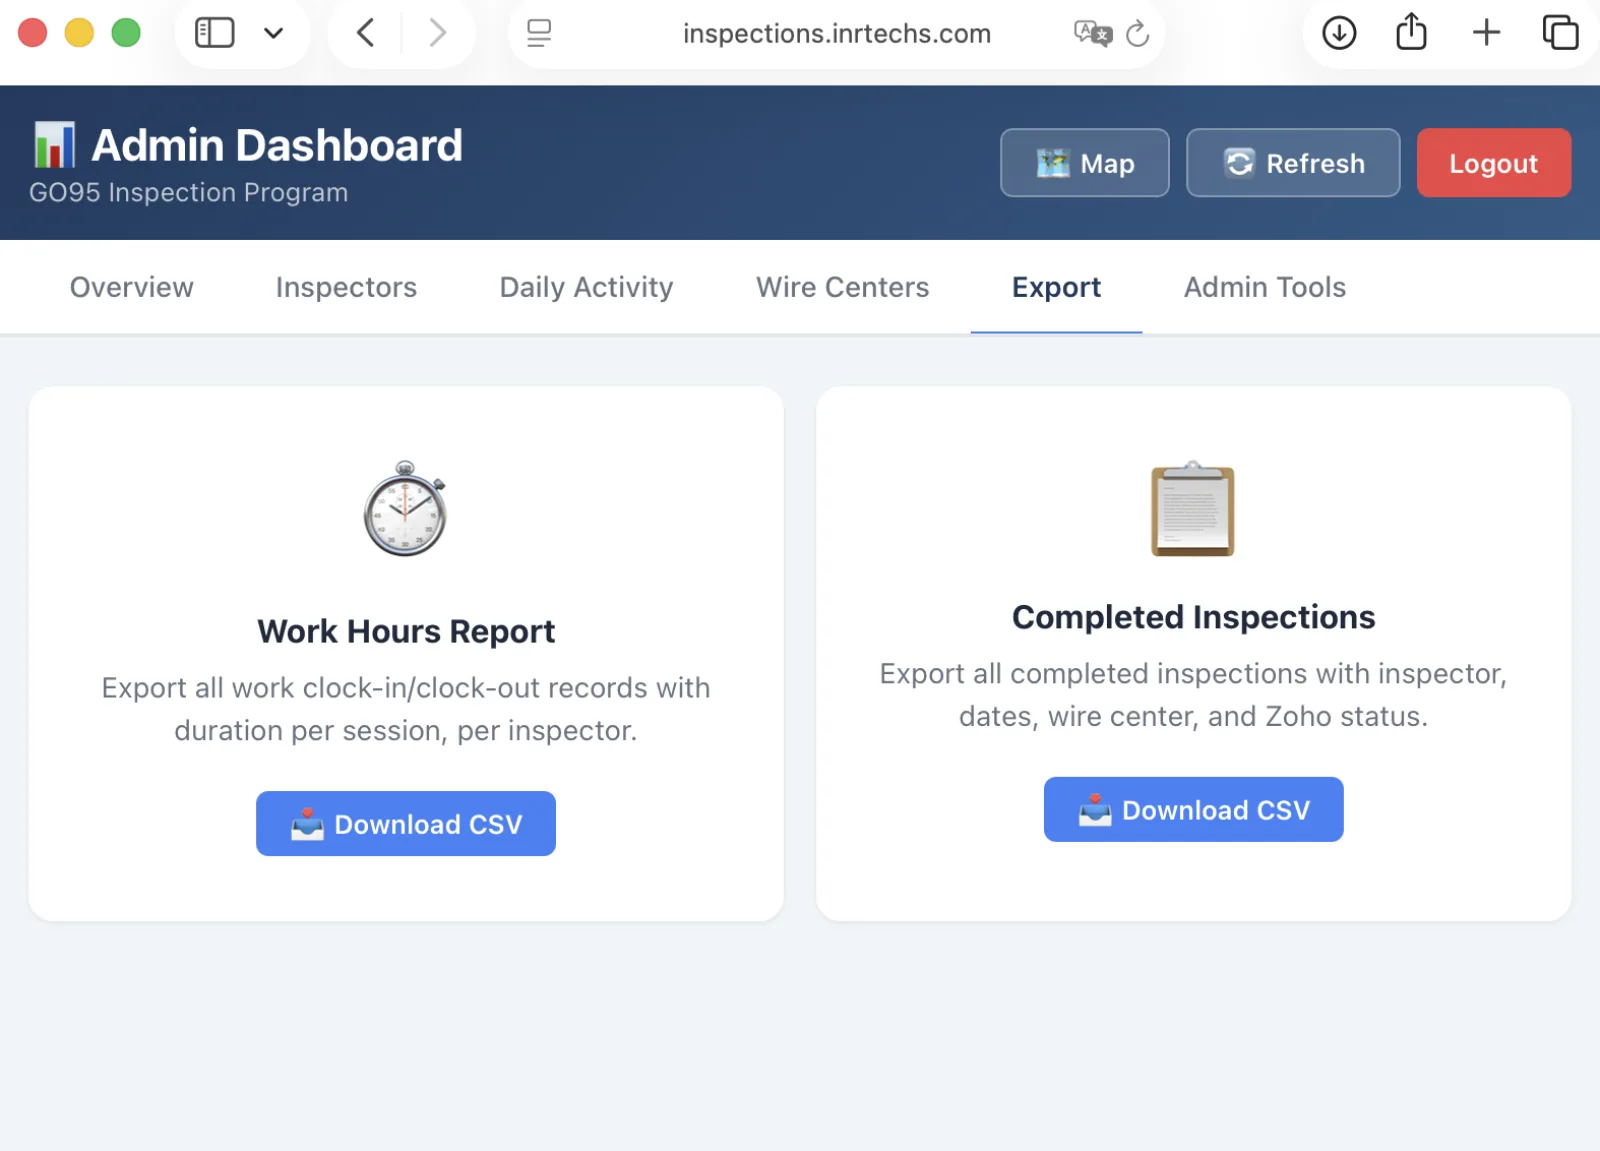
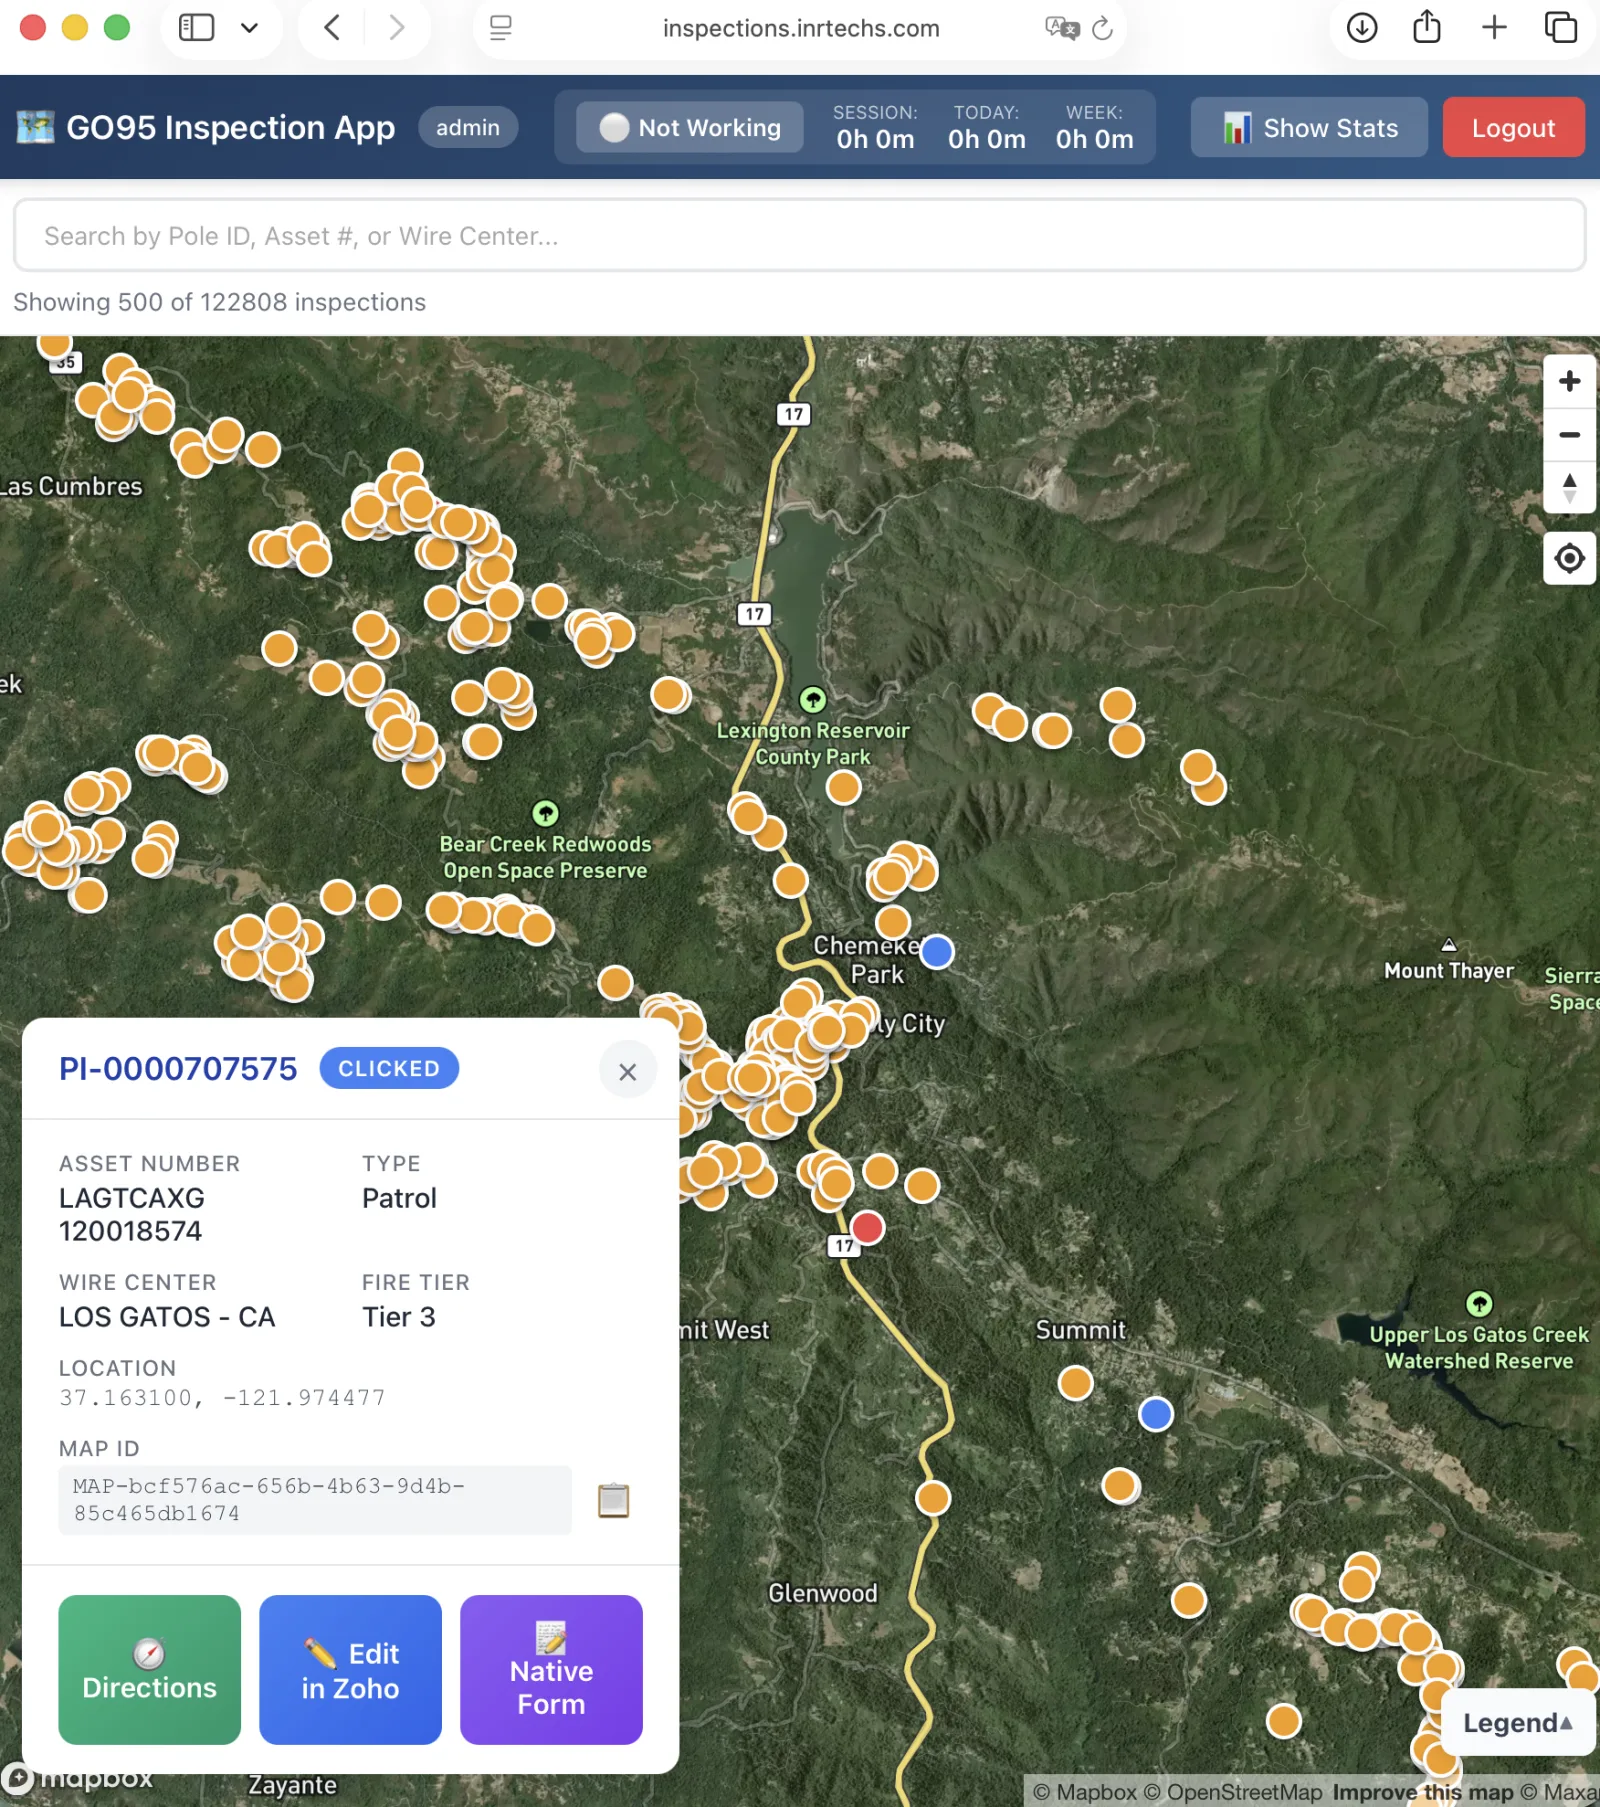
The GO95 Inspection App standardizes and automates every step of utility pole inspection — routing, time tracking, data capture, and live reporting — into a single mapping platform managing 188,000+ inspections across California's high‑fire‑threat districts.

📍 GIS · Mapbox ⚡ Node + React PWA 🔗 Zoho Creator integration 🔒 GO95 compliance ready
inspections.inrtechs.com
GO95 Inspection App map view with hundreds of pole markers and a detail popup
Scroll
The Problem

Field inspection programs were
held together by spreadsheets.

Utility inspectors in the field were juggling printed maps, paper sign‑in sheets, separate data‑entry portals, and fragmented reporting tools. Production was invisible until end‑of‑week. Routes were guessed. Data quality varied by inspector. Compliance audits were reactive.

📋

Disconnected tools

Routing in Google Maps, data in Zoho, hours in a separate timesheet, reports in Excel — six tools per inspector, none of them talking to each other.

⏱️

No live visibility

Program managers found out about delays days late. There was no way to see who was working, where, or how production was tracking against the GO95 deadline.

🗺️

Inefficient routing

Inspectors decided their own daily routes, often driving past dozens of poles to reach an assignment in the wrong order — costing hours of windshield time per crew, per day.

The Solution

An end‑to‑end field operations platform.

A single web + mobile PWA that an inspector logs into in the morning and stays in until end of day — handling everything from "where do I go next?" to "submit the inspection." Every action is captured, time‑stamped, and rolled up into live dashboards for program managers.

🗺️

GIS Mapping

Mapbox‑powered map of every assigned pole, color‑coded by status, fire tier, and inspection type.

📝

Data Capture

Zoho Creator forms launched in‑context with pre‑filled asset data and an auto‑generated Map ID.

Time Tracking

Automatic clock‑in/out, GO95‑compliant 8‑hour daily caps, stuck‑session protection, and per‑inspector hour reports.

📊

Live Reporting

Real‑time dashboards: completion rate, daily activity, per‑inspector throughput, wire‑center progress.

Feature 01 · Live Map

Every assigned pole, on one map.

A high‑performance Mapbox view that renders 122,000+ active inspection points across California — clustered intelligently as you zoom out, fully interactive when you zoom in. Inspectors see only their assigned work; admins see the entire program.

  • Satellite + street basemaps with viewport‑based loading for performance
  • Search by Pole ID, Asset Number, or Wire Center
  • Role‑aware filtering (inspector vs admin) at the API layer
  • One‑tap "Get Directions" launches Apple/Google Maps turn‑by‑turn
inspections.inrtechs.com
Statewide map view showing inspection load zones across California
inspections.inrtechs.com
Map detail with color-coded status markers and inspection popup
Feature 02 · Status Tracking

Color‑coded markers tell the whole story at a glance.

Every marker reflects live inspection state. As an inspector taps an asset, generates a Map ID, completes the form, and the record syncs to Zoho — the marker color changes in real time across every screen, including the program manager's dashboard.

Patrol — Pending Detailed — Pending Intrusive — Pending Clicked Pending Sync Completed
Feature 03 · Inspection Workflow

From map tap to filed inspection in under 60 seconds.

The inspection popup consolidates everything an inspector needs in the field: pole metadata, GPS, fire tier, the asset record — and three action buttons that handle 95% of field work.

inspections.inrtechs.com
Inspection popup with Directions, Edit in Zoho, and Native Form action buttons
Step 01

Tap a marker on the map

The popup loads asset details, fire tier, GPS coordinates, and any prior inspection state.

Step 02

Auto‑generated Map ID

A unique MAP‑bcf376ac… identifier is created and threaded into every downstream record.

Step 03

Choose your action

Directions for navigation · Edit in Zoho opens the pre‑filled Creator form · Native Form for offline‑capable inline capture.

Step 04

Submit and move on

Status updates everywhere instantly. The marker turns green. The dashboard increments. No double‑entry.

Feature 04 · Inspector Stats

Inspectors see their own production — instantly.

A one‑click stats panel surfaces totals, completion progress, and breakdown by inspection type. No more waiting for a Friday email to know where you stand against your assigned book.

188,821
Total inspections
36.3%
Completion rate
5,196
Done this week
inspections.inrtechs.com
Inspection statistics modal showing total, pending, completed, and per-type breakdown
inspections.inrtechs.com/admin
Admin dashboard overview with KPIs and overall progress bar
Feature 05 · Admin Dashboard

Program management, in real time.

A purpose‑built admin console that turns 188K rolling records into the four numbers an operations manager actually needs to make decisions: today's production, this week's pace, who's working, and what's left.

  • Six dedicated tabs — Overview · Inspectors · Daily Activity · Wire Centers · Export · Admin Tools
  • Live work‑hour totals, active worker counts, weekly averages
  • Drill from a KPI directly to the underlying records
Feature 06 · Daily Activity

14‑day rolling production at a glance.

A horizontal bar view of the last two weeks: completed inspections, marker clicks (work in progress), and total work hours per day. The shape of the chart tells the story — Tuesdays are heavy, Sundays are light, and a slow week shows up before the deadline does.

  • Inspections completed, clicks attempted, and hours worked — per day
  • Identifies trends: which inspectors are scaling, which days are losing time
  • Same data feeds the Inspectors and Wire Centers tabs for slice‑and‑dice analysis
inspections.inrtechs.com/admin
Daily activity chart showing 14 days of inspection production
inspections.inrtechs.com
GO95 Inspection App login screen
Feature 07 · Compliance & Sessions

GO95‑aware time tracking — built in, not bolted on.

JWT‑secured authentication with role‑based access and automatic enforcement of regulatory limits. The platform treats time tracking as a first‑class concern, not an afterthought layered on top of a pre‑existing app.

  • 4‑hour session caps with auto‑logout and 30‑minute cooldowns
  • 8‑hour daily maximums per inspector, surfaced in the header at all times
  • Immutable audit trail of every clock‑in, click, and submission
  • Two roles — Inspector (assigned work only) and Admin (program‑wide access)
Feature 08 · Operational Tools

Self‑healing operations.

Real field deployments are messy: inspectors close the app without logging out, devices die in the field, sessions go stale. The platform's Admin Tools tab handles those edge cases without involving a developer.

  • Stuck Work Sessions — surface and close orphaned sessions in one click
  • Map Cleanup — automatic 48‑hour archival of completed inspections to keep the map fast
  • 12‑hour session caps — anomaly protection for sessions that never closed
  • Auto‑close on logout — work sessions terminate cleanly with the user session
inspections.inrtechs.com/admin
Admin Tools tab with stuck session management and map archive controls
inspections.inrtechs.com/admin
Export tab with Work Hours and Completed Inspections CSV downloads
Feature 09 · Reporting Exports

One‑click reporting that finance and compliance can actually use.

Two CSV exports cover virtually every recurring reporting need: a per‑inspector hours roll‑up for payroll and program billing, and a full inspection record dump for QA, GO95 audits, and executive reporting.

  • Work Hours Report — every clock‑in/clock‑out, session duration, by inspector
  • Completed Inspections — full asset roster with inspector, dates, wire center, Zoho status
  • Both exports stream server‑side — no row limits, no spinning UI
Under the hood

Pragmatic stack. Production‑grade architecture.

Built to be deployed once and run for the full GO95 program cycle without operator intervention. Every component was chosen for the same reason: it should keep working when there's a 4G cell tower involved.

⚛️

Frontend

React PWA · Mapbox GL JS · service‑worker caching · "add to home screen" install

🟢

Backend

Node.js + Express · JWT auth · role‑based middleware · stateless API

🐘

Data

PostgreSQL + PostGIS · 188K spatial records · CSV ingestion pipeline

☁️

Hosting

AWS Elastic Beanstalk · custom .platform hooks · Route 53 + ACM TLS

React 18 Mapbox GL JS Node.js Express PostgreSQL + PostGIS JWT Zoho Creator API AWS Elastic Beanstalk Service Workers / PWA IndexedDB (offline) OpenWeather (planned)
The numbers

One inspection program. One platform.

Live numbers from the active production deployment as of May 2026.

188,821
Inspections under management
across California's high‑fire‑threat districts
68.6K
Inspections completed
36.3% program completion to date
742/day
Average daily throughput
across active inspector crews
6 → 1
Tools consolidated per inspector
203.5 hrs
Logged this week
122,808
Live points on the map
66,013
Auto‑archived (48h sweep)
Built by Jeff Brooks · BC Technology Group

Have a field‑ops problem that looks like this one?

I build operations software for utilities, contractors, and field‑services teams — the kind of tools where "production grade" means "works on a 4G hotspot in the foothills." If that sounds familiar, I'd love to talk.